Part 3. Analyzing your content with the Content Dashboard
This is Part 3 of a series on Google Analytics for freelancers and bloggers. Previously, we created customised dashboards to master the data and looked into traffic metrics with the Traffic Dashboard.
Our aim is all about growing the blog’s audience. Let’s dive into the content analysis to learn:
– How your content works
– How long visitors are staying
– Where visitors come from
– How many pages they view and where they exit
Our Content Board has 5 widgets to help us find the most popular and engaging content. I’ll add clickable links to them and include analysis tips.
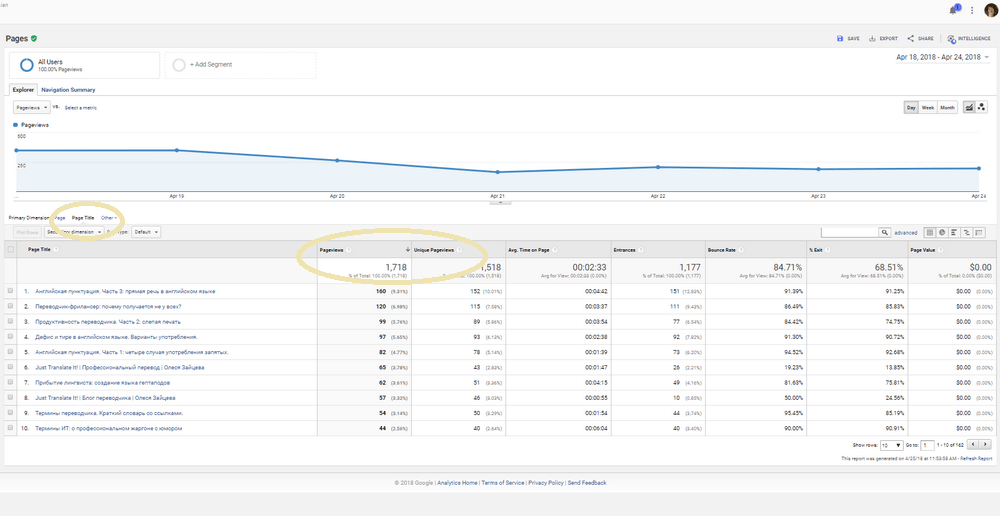
1. Pageviews and Unique Pageviews by Page Title
The widget indicates what content is driving attention to your website. Pick your top 10 posts each month and read them looking for typos and awkward phrasing. Add new long-tail keywords relevant to your services, links to newer published post or even update the information if you have something to add.
The constant maintenance can be time-consuming, but this is the content that attracts visitors to your site. The top posts should be always optimized for SEO as they can bring you traffic for years to come. You can capitalize on it by adding relevant calls-to-action to all the top pages.
The term ‘unique pageviews’ means that if a user views the same page more than once in a session (for example, refreshing the page in their browser), this will only count as a single unique page view. Unique Pageviews metric is always going to be equal to or lower than the Pageviews metric.
We can add a direct link to the detailed report making the widget’s headline clickable. Go Behaviour > All Pages > Page Title tab. Copy the address in the URL field. Open the Widget Settings window and paste in the copied link in the Link to report or URL field. Now we have a clickable widget name to drill down our data.
 2. Visits and % New Visits by Landing Page
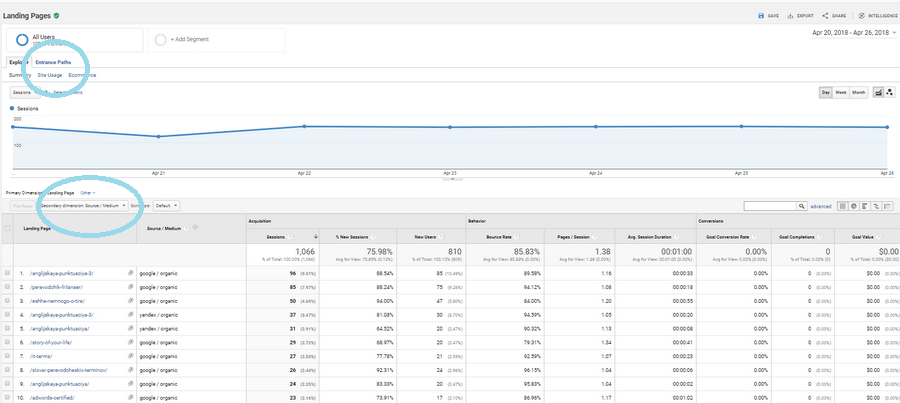
A landing page is the first page a visitor views when they come to your website, the first impression they get from it. Here you see which blog posts tend to catch user attention in search results.
You can assume that new visits mean the same as new users, although it is possible for a new user to have several sessions during the period, only one of which would be a ‘new’ visit. If possible, try to select a significantly large date range to get the best results.
This data can be further segmented by adding a secondary category such as the “Source or Medium” on the report page. Go to Behaviour > Site Content > Landing Pages. Click Secondary Dimension and type Source/Medium.
Pay attention to the Entrance Path tab which shows you where visitors when after visiting the landing page (don’t forget to choose the landing page you need form a drop-down list).
Now you can copy the URL and add it to the widget to make its title a direct report link.
3. Average Time on Page and Bounce Rate
You might be interested not only in numbers based on pageviews and visits. Do you want to know if people are finding your content useful? Are they staying on a page for a significant amount of time or leave immediately?
Most new visitors won’t stay long on your blog (don’t worry as it’s typical of the web). But if less than 10% of all sessions last for more than a minute, your content is definitely not engaging. To see the average engagement for your website, navigate to Audience > Behavior > Engagement. You’ll see the breakdown of overall session duration data.
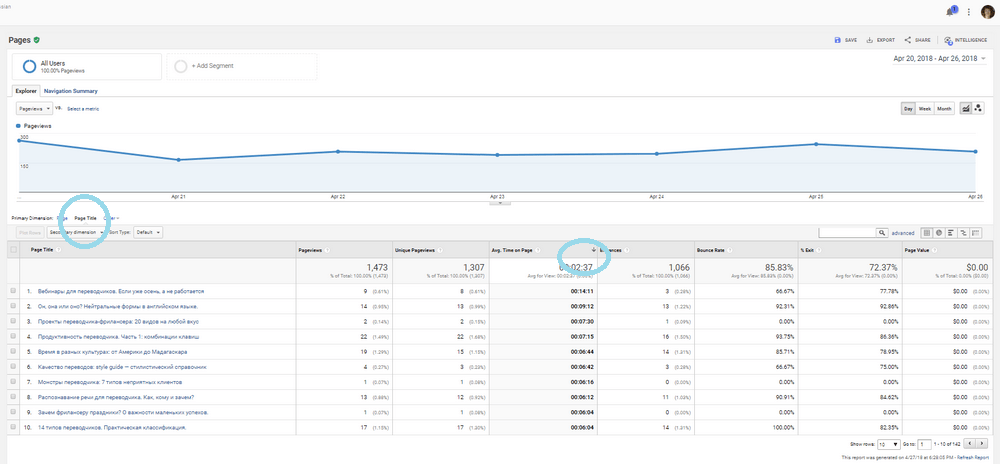
However, it’s most beneficial to find out how long readers are sticking around on a page-by-page basis: this is exactly what the Average time on Page metric is for.
Bounce rate tells you how many of your visitors came, saw, and left before doing anything. If they came to see one specific post and left after reading it that would still be a bounce. So, there is no need to be in a bother. To improve your bounce rate (the lower, the better), encouraging an action at the end of each post (related posts, subscribe links, etc.).
To add a link to the main report, go to Behavior > Content > All Pages. Click on Page Title tab, then sort the pages in the Avg. Time on Page column. Copy the URL and add it to the widget if you need a clickable widget title.
4. Exits and Pageviews by Page
It’s inevitable that visitors will leave your website. But we want to be sure that the reason is not a shallow or unsuitable content of unfriendly user experiences when they can’t find the next post to read or additional information on your services.
Exit pages are the pages that visitors see before leaving your website. Ideally, you’d want to see contact pages high in this list as a final part of “visitor’s journey.”
Check the top pages in this list monthly as they may have an error message like “404 Page Not Found.” By fixing them you would greatly improve overall website performance. Another reason to monitor the report is to understand what pages you could improve to keep users on the website and completing conversions (sending a message, subscribing, etc.).
To improve the performance of pages with a high exit rate:
- Add internal links to other blog content
- Add a Related Posts widget at the bottom of your post
- Add a Popular Posts widget to your sidebar
To see a report about exit pages, navigate to Behavior > Site Content > Exit Pages. You can copy and add the link to the Content Dashboard widget.
5. Pageviews by Сountry / Territory
Even if you’re an online business that can work with any country in the world, you still have your top preferences. Maybe you target Russian-speaking clients. Then, you’d want to make sure Russian-speaking people are coming to your site. (You also have a separate report for visitors’ languages in Audience > Geo > Language.)
A piechart showing how many people came from which countries may be helpful if you’re targeting certain areas. If you run a local business, this is really important. Knowing where your audience lives can influence the keywords you’re using on your site.
To see what pages are popular in your top countries, navigate to Behavior > All Pages, click Secondary Dimension and type in Country.


