Part 4. Tracking website performance metrics
This is Part 4 of a series on Google analytics for freelancers and bloggers. Previously, we:
- created customised dashboards to master the data,
- looked into traffic metrics with the Traffic Dashboard,
- and analysed the best performing content with the help of the Content Dashboard.
An important part of your SEO strategy is to know how your website is running. With the Performance Dashboard consisting of 8 widgets, you’ll see:
– How quickly your website loads
– Where your visitors are coming from
– If you should act because something isn’t working as it is meant to
1. AVERAGE PAGE LOAD TIME
Website speed has key importance for user engagement. If your website makes users wait, they will eventually get bored and leave. Page load time is also a factor in Google’s desktop search results rankings.
If you have a high page load time, it’s not always the content to blame. Since the number includes all steps, the time depends from redirects, server-side calls, the user’s location and network connection.
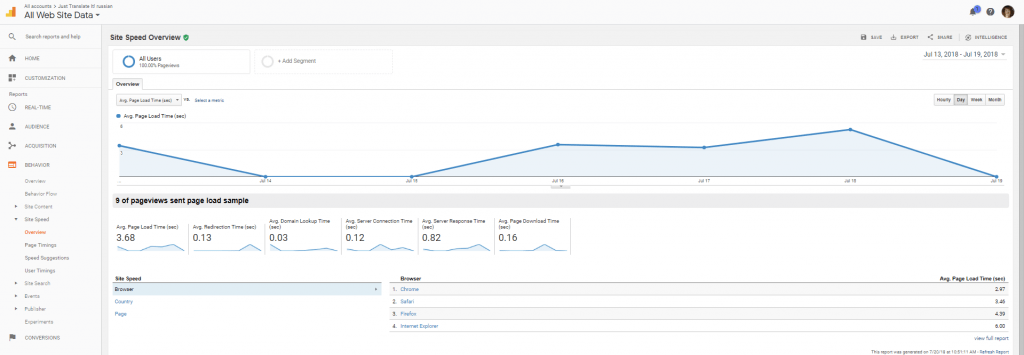
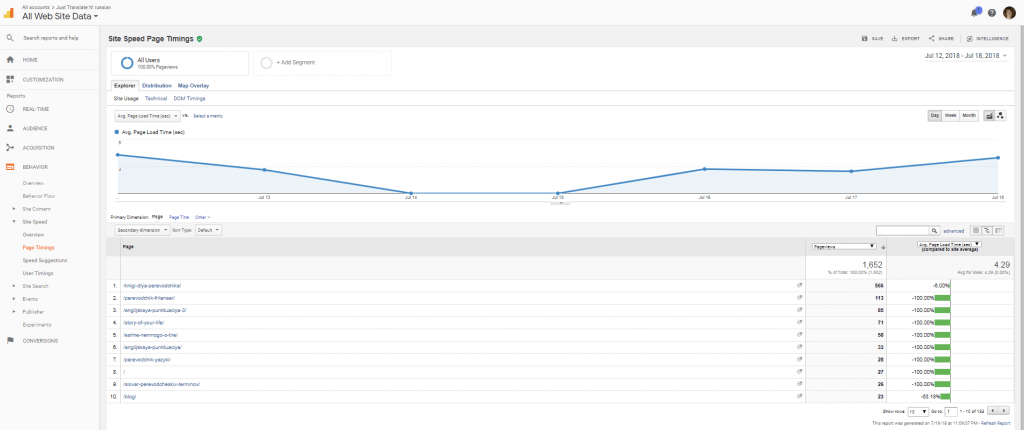
To see the speed of separate pages, go to Behavior > Site Speed > Page Timings. The report details each page along with the total average loading time (in seconds). Copy the URL and add it to the widget if you need a clickable widget title. Get an overview of website speed at Behavior > Site Speed > Overview.
Some other simple site speed tools:
- Pingdom: a simple tool but method of testing is undocumented.
- GTmetrix: gives actionable insights about the best way to optimize webpage speed.
 2. MOBILE PAGE LOAD TIME (SEC)
The last few years have all been about the mobile: after 2014 mobile usage is greater than desktop use. In July 2018, Google adds mobile page load times to the factors for mobile search result rankings.
According to Google, the average time it took in 2017 to fully load the average mobile landing page was 22 seconds. However, research also indicated that 53% of people would leave a mobile page if it took longer than 3 seconds to load.
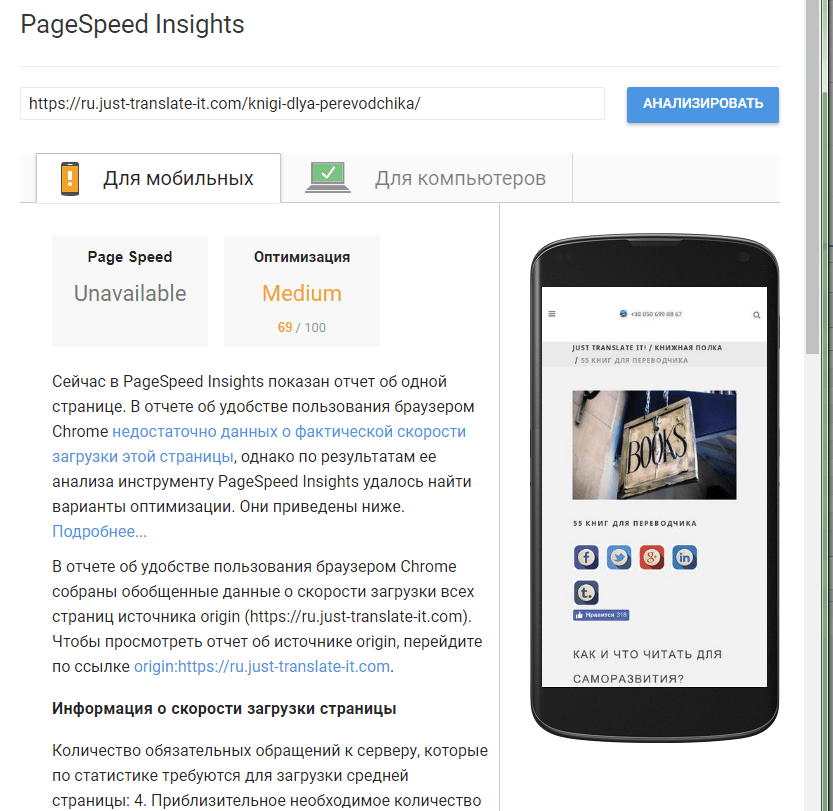
There are insights available for speeding up your site for mobile devices. These can be found under Behavior > Site Speed > Speed Suggestions. The Hostgator’s blog offers more free Google tools to improve your mobile page load time.
3. LOAD TIME FOR POPULAR PAGES
Here you can compare the average page load time with the metric for your most popular posts.
If you want to speed up your most viewed pages to enhance their visibility further, consider optimising the images (you can use the image optimisation method offered by HubSpot). You can also hide certain elements on the sidebar that are not so necessary.
The full report available at Behavior > Page Timings shows the load time for popular pages compared to the site’s average.
4. AVERAGE SERVER RESPONSE TIME
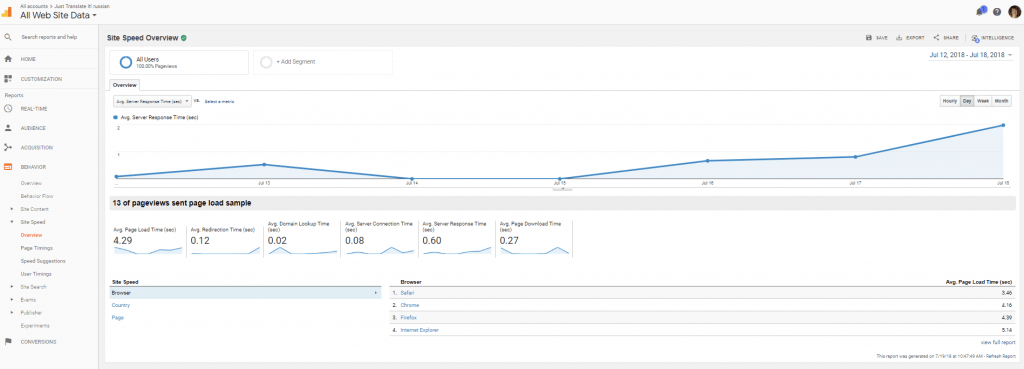
The average amount of time that it takes for the site’s server to respond to what a user is doing such as clicking through pages. A well built web page will still be displayed slow if the server response time is slow. Google recommends to reduce the server response time under 200ms.
To improve server response time look into caching plugins and content delivery networks like Cloudfare. It’s also important to compress your assets using a method such as Gzip or Brotli, minify your CSS, JS, and HTML files, and optimise your images.
To add a direct link to the widget’s title, go to Behavior > Site Speed > Overview.
5. SERVER RESPONSE TIME BY COUNTRY
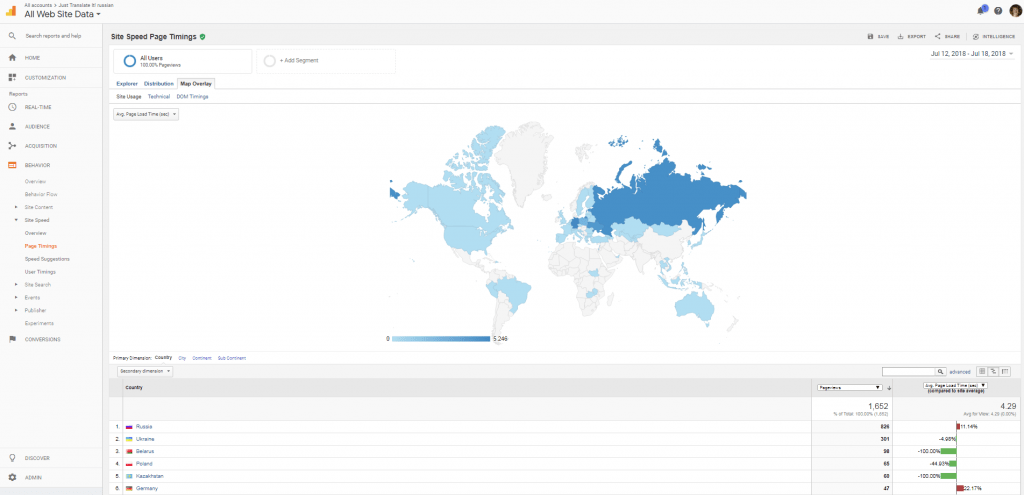
Here you can see if certain countries are slower to load your website’s pages. To get the full report, go to Behavior > Site Speed > Page Timings and switch to the Map Overlay tab.
If country-specific performance is important for your strategy, you might consider using a server based in that country (with the help of your hosting provider) or use a content delivery network.
6. AVERAGE PAGES VIEWED PER VISIT
Defined simply as the total number of pages viewed divided by the total number of visits to the site, Average Pages Viewed per Visit is a key indicator of your content’s attractiveness.
You want people to visit multiple pages on your site (over 3 to 4) because it means that readers come to your blog and want to stick around.
If you think there’s still room for optimisation, ask yourself:
1. Is it possible to update high-bouncing pages with news facts or research?
2. Could the formatting be better?
3. Could any images or videos be added?
4. Do the pages really match the keyword phrase ranking for in Google?
5. Could you improve the title tags and meta descriptions?
Go to Audience > Behaviour > Engagement to see the number of pages viewed by different users. The highest number for me this week is 19.
To make a clickable widget title, navigate to Audience > Overview. You can copy and add the link to the widget in the Performance Dashboard.
7. AVERAGE TIME ON SITE
Average session duration (time spent on your website) is a simple number fundamental for content sites like blogs. More time means better connection with the content.
Watch for dramatic changes in the average time the visitors are spending on your website as they indicate a significant change in your audience. Remember, though, that the results can be misleading because the visitor could have left the browser window open and was not actually viewing your page.
Additionally, it is an average of metrics which are themselves averages of other metrics which are themselves averages, and so on. To get a better insight, consider the average session duration for each individual traffic source (Acquisition > All Traffic > Channels).
The direct link for a clickable title is the same as for the previous widget: Audience > Overview.
8. VISITS BY DAY SINCE LAST VISIT
Do your visitors only come once and never return? Or do some visit your website three times a week or even more?
The widget shows the number of days between the latest visit and the visit before that. 0 days since last visit means that the user have been to your website once.
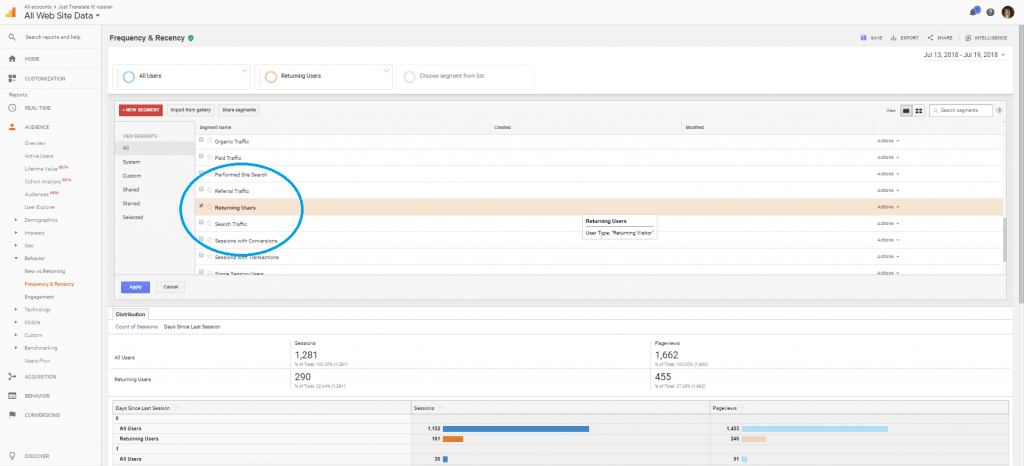
The full report available at Audience > Behavior > Frequency and Recency shows both days since last session and the count of sessions with pageviews to understand how loyal your visitors are.
To make better use of the Recency report, click Add Segment and choose Returning visitors.
Next month comes the forth dashboard, the Social Dashboard. And after that we’ll see what metrics should be monitored weekly, monthly, and yearly.


